
At a glance
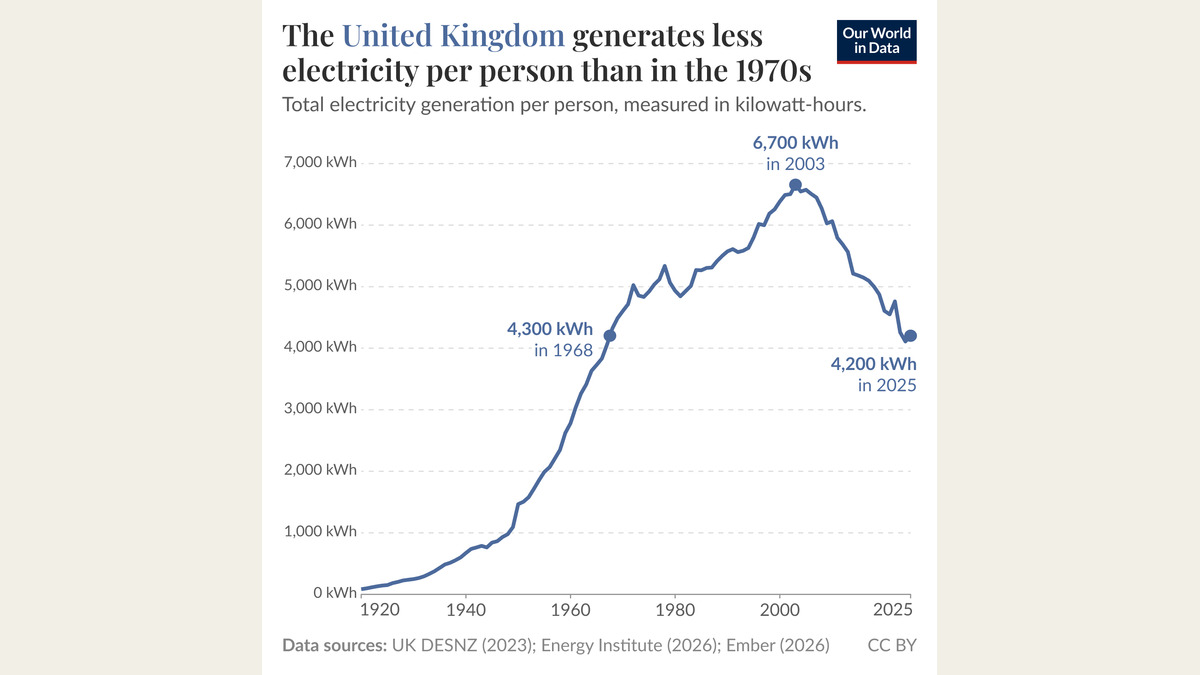
- Our World in Data’s 3 October analysis puts UK electricity generation per person at about 4,200 kWh in 2025, down from roughly 6,700 kWh at the 2003 peak.
- Net imports supplied 9% of electricity demand in 2025, up from 1% in 2010; domestic generation and domestic consumption are therefore not interchangeable.
An Our World in Data analysis published on 3 October 2026 shows a long reversal in UK electricity generation per person. The series reaches about 6,700 kilowatt-hours in 2003 and falls to roughly 4,200 kWh in 2025—a decline of more than one-third and a level below the chart’s 1968 reading of about 4,300 kWh.
The article makes an important measurement distinction. Part of the fall in domestic generation reflects more electricity arriving from outside the country: net imports increased from 1% of demand in 2010 to 9% in 2025. Consumption has still fallen, but the output produced within a country is not the same measure as the electricity used there.
The decline is also broader than a factory-only story. The source reports that industrial electricity consumption has fallen by about one-quarter since 2005, while residential and commercial use have fallen by a similar amount. It identifies efficiency improvements, including lighting and appliance efficiency, as an important part of the explanation alongside the changing structure of the economy.
Dunes Bureau interpretation: a smaller annual total does not by itself make an electricity system simpler to plan. Generation per person says how much domestic output was produced across a year. It does not show when demand peaked, how much capacity was available at that moment, where network constraints appeared or how reliance on imported supply changed operational exposure.
For an industrial operator, property owner or utility customer, those distinctions change the commercial question. Annual consumption can fall while the cost of meeting a short, high-demand interval remains material. A useful operating dashboard should therefore separate total consumption, peak load, domestic or on-site generation, imported supply and service reliability rather than compressing them into one trend line.
Dunes Bureau interpretation for Gulf operators: the UK history is a measurement lesson, not a forecast for a market with different weather, demand growth and system design. The transferable practice is to reconcile the annual figure with the shape and source of supply before using it for capacity, efficiency or investment decisions.
The source supports a conclusion about the direction and composition of a historical change. It does not provide a capacity forecast, a price outlook or evidence that lower annual use guarantees lower system cost. The next useful evidence is more granular: demand by hour and sector, matched with domestic generation, imports, outages and network performance.
Sources
Electricity generation per person in the United Kingdom has fallen by a third from its early-2000s peak — 3 October 2026 ↗
Hannah Ritchie · Our World in Data. Accessed 2026-10-04. CC BY 4.0; chart and third-party exceptions checked.