
At a glance
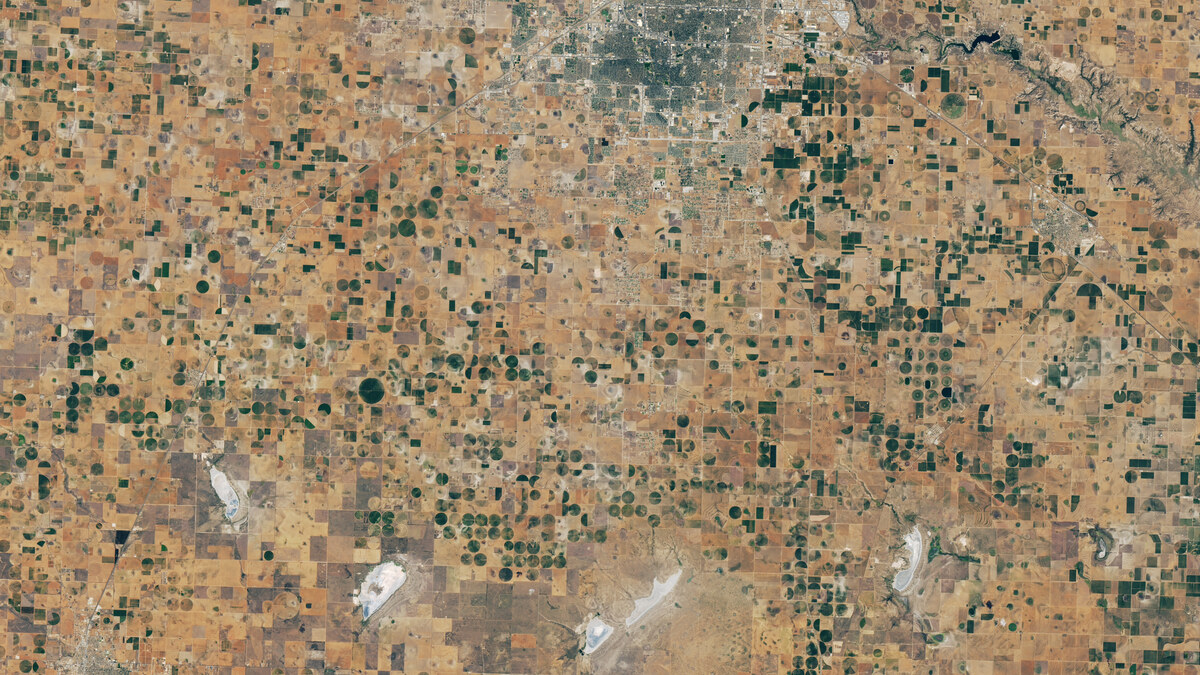
- A 9 September Landsat 8 image shows parched fields and mostly dry playa lakes around Lubbock compared with a greener September 2025 view.
- NASA reports that the water table across much of Lubbock County has fallen by 25 to 100 feet since 1950, based on U.S. Geological Survey data.
- The imagery identifies where water stress is visible; it does not by itself estimate regional cotton output, prices or insured losses.
NASA Earth Observatory published a Landsat-based report on 8 October 2026 showing how drought and long-run groundwater decline are converging in the Texas High Plains. The region is described as America’s largest cotton-producing area. A 9 September 2026 Landsat 8 image shows brown fields, vacant plots and mostly dry playa lakes around Lubbock, while a 22 September 2025 image of the same area is markedly greener.
The comparison is useful because it separates a visible change in field conditions from a broad drought label. NASA says some growers have responded to scarce groundwater by irrigating only one-half or one-third of their centre-pivot fields, patterns that appear as green semicircles and quarter circles in the satellite view. The report also notes that many playa lakes were dry in September 2026; when functioning, these shallow features can collect rainfall and help recharge the aquifer used for irrigation.
The problem is not only one dry season. Citing U.S. Geological Survey data, NASA reports that the water table across much of Lubbock County has declined by 25 to 100 feet since 1950, with losses of 150 feet or more in several counties farther north. NASA says drought remained severe across much of the Texas High Plains in October despite recent rain. Those facts describe a narrowing water buffer, not a forecast of when any particular farm will exhaust its supply.
What the image can—and cannot—tell a business
Dunes Bureau interpretation: the satellite image is most useful as an operating-risk screen. A producer, lender, insurer or buyer can use the field pattern to decide where to ask more precise questions about irrigation capacity, well performance, planted area and crop condition. The image cannot replace those records, but it can show where last year’s assumptions about water availability may no longer be safe.
The same caution applies to supply-chain conclusions. NASA’s report documents stressed land and examples from individual farms, but it does not provide a regional 2026 production estimate, a loss total or a price forecast. Turning the image into a cotton-market claim would require acreage, abandonment, yield and inventory data collected on a consistent basis.
The durable follow-up is therefore operational rather than dramatic: compare the Landsat signal with well measurements and crop records, track which playa-restoration or water-efficiency measures change outcomes, and repeat the view across seasons. If the visual pattern persists, water availability becomes a capital-allocation constraint for the region’s cotton economy rather than a temporary weather exception.
Sources
Fighting Drought in Texas Cotton Country — 8 October 2026 ↗
Adam Voiland · NASA Earth Observatory. Accessed 2026-10-08. NASA factual commercial editorial usage and AI source-disclosure guidelines; third-party exceptions checked.